
The DSCR Dividend: How One Lending Product Changed the Game for Real Estate Investors and Communities

Executive Summary
I've had a theory for a while now: the DSCR loan didn't just give real estate investors another financing product; it de-risked the whole game.
By giving investors a dependable refinance-to-rental exit, DSCR lending changed which deals they were willing to attempt in the first place. If that's true, it should show up in five places: refinance volume through a rate shock, the vacant-property share of DSCR purchases, flip activity in historically disinvested neighborhoods, vacant-building counts, and the Black homeownership rate.
I built this thesis, then spent real effort trying to break it, running four falsification tests against Baltimore courthouse records, 39-metro HMDA data, and four decades of rate-shock history. Two tests confirmed it, one came back null, and one split. I'm reporting all four, including the one that failed. That's the only way a claim like this is worth anything.
A Working Theory
The DSCR loan didn't just give real estate investors another product. It de-risked the game itself.
That's the theory I've been sitting with for a few years: the existence of a reliable DSCR refinance encouraged more risk-taking by investors, more flips in harder neighborhoods, more renovations of long-vacant properties, more capital flowing into markets that conventional lenders had largely written off. If the theory holds, its secondary effects should show up in the vacant-building counts and the Black homeownership rate, since those are the populations and geographies where this mechanism operates most directly.
I asked the data to prove me wrong. Here's what came back: the confirmations and the parts that didn't hold up.
A note on methodology: the underlying data work, county records via Elementix, 59 million-plus HMDA loan records, Census data, ATTOM, KBRA, Urban Institute figures, and roughly 75 Baltimore deed chains, was pulled and processed by AI at my direction. I did not steer the conclusions.
Claim 1: DSCR Became a Reliable, National Refinance Backstop
Before 2020, if you owned rental property and needed to refinance, you had two doors, and neither was one you could count on at the moment you actually needed it.
Door one was Fannie Mae: personal-income DTI underwriting, a ten-financed-property ceiling, no LLC vesting, and reserve requirements that stack up fast. Door two was your local bank: global cash-flow underwriting, personal recourse, a five-year balloon, and a committee that moves at committee speed. I spent years walking through both doors. "Reliable at the moment of need" is the entire job description of a back-up plan, and neither one qualified.
DSCR changed that. The product was invented by PE-backed landlord lenders in 2013 to 2015, got its securitization takeout in 2015 to 2016, and was commoditized in 2021 to 2022. By 2024, DSCR had overtaken bank-statement loans to become the largest product in non-QM, roughly $50 billion or more per year, against maybe $5 to $7 billion in 2019. The pie grew for us because the pie over at the banks was shrinking. And once the securitization market matured, this product was never going back in the bottle.
The county records confirm it. Private-lender, long-term, business-purpose loans grew 7 to 14 times over from 2019 to 2025 in every state I pulled, and volume kept growing straight through the 2022 to 2023 rate shock, even as agency refinance volume collapsed roughly 70 percent in 2022.

Two things in those curves matter more than the raw growth. One, the shape is national. Maryland isn't the story; Ohio's curve is steeper than ours. Two, and this is the heart of it, the growth runs straight through the rate shock. A capital source that keeps lending when rates double is what "reliable" means.


Claim 2: DSCR De-Risked the Marginal Deal
The de-risking argument is an options argument. A flip in a thin market is a bet with a fat left tail: the house doesn't sell, and now you're stuck paying hard-money interest on an albatross. A credible refinance-to-rental exit cuts that tail off. You're no longer underwriting "what if it doesn't sell" as a catastrophe, you're underwriting it as a rental you hold at a workable coupon until the market comes to you. That changes which deals get attempted in the first place.
Three pieces of evidence say this isn't just theory.
First, according to KBRA's study of securitized DSCR collateral, 82 percent of securitized DSCR purchase loans are on vacant properties. This is the product that buys and stabilizes empty houses at scale.
Second, the renovation-loan market scaled from roughly $10 billion in 2022 to an estimated $85 billion-plus in 2025, and it only scaled after the takeout existed. The same aggregators run both products. The reno loan and its back-up plan are the same balance sheet.
Third, flip margins compressed to a 17-year low while volume held. Gross flip ROI fell from roughly 46 percent in 2015 to 25.5 percent in 2025, yet flip counts stayed near 300,000 a year. Rational investors accept thinner expected margins when the tail risk shrinks. Before DSCR, a 25 percent gross margin in a slow market was uninvestable. With the refi exit, it clears.
The BRRRR economy is this theory, operationalized. Buy-rehab-rent-refinance-repeat only works if the last R is dependable. Every BRRRR investor is running this mechanism on purpose. For them, the DSCR refi isn't the backup plan; it's the business plan. Either way, the house gets renovated.
Claim 3: Renovation Moved Into the Tougher Zips, and the Vacants Came Down
National flip volume rose from roughly 180,000 in 2015 to a 407,000 peak in 2022 and settled near 300,000. But the more important question is where. The highest flip-rate geographies in the country are persistently low-priced, majority-Black urban zips: Memphis's 38116, Philadelphia's 19150, Baltimore's 21223, Detroit's 48228. The Washington Post found investors bought 30 percent of the homes sold in majority-Black ZIPs in 2021, versus 12 percent everywhere else.
Flipping isn't a coastal game; it's a legacy-city, cheap-housing-stock game. Which is exactly where a back-up plan changes behavior the most, because those are the markets where "what if it doesn't sell" used to kill the deal before it started.

In Baltimore, the city's share of metro flips went from 19 percent in 2020 to 40 percent in 2023 to 43 percent year-to-date in 2026. Renovation capital moved toward the harder markets as the back-up plan became more reliable.


Baltimore's vacant-building notices fell from 16,707 in October 2018 to under 12,000 in 2026, a two-decade low. This isn't just a Baltimore story: national vacant units fell from roughly 19 million in 2010 to 15.1 million in 2024; Philadelphia's suspected-vacant inventory dropped from roughly 42,000 in 2019 to 21,000 in 2025; Detroit's land-bank abandoned inventory went from roughly 47,000 at peak to 942 by December 2025- yes, three digits.
Attribution honesty: public money worked the same streets during this period. Project CORE put $167 million into Baltimore demolition and predevelopment, and Detroit's decline is mostly a demolition story, not a renovation story. DSCR is one engine among several here, and I'm not going to pretend the data can cleanly split the credit.
Claim 4: Black Homeownership Rose Faster Than White Homeownership
The Census tells a clean before-and-after story.
In the pre-DSCR expansion from 2016 to 2019, a good economy with decent rates, the Black homeownership rate crawled up 0.6 points while white homeownership rose 1.4. The gap widened to its modern-era high of 31.3 points in 2019. Low rates alone weren't closing anything.
Then the pattern inverted. From 2019 to 2024, Black homeownership rose 3.7 points against white's 0.8, compressing the gap to 28.5, the tightest annual print in the modern series.


Baltimore added 10.2 percent more Black owner households over this period, the cleanest owner-count growth of any city I tested. In legacy flip-market cities broadly, five of eight posted Black homeownership gains above the national average: Detroit (+3.9), Cleveland (+5.2), St. Louis (+4.5), Birmingham (+8.9), and Pittsburgh (+7.0).
The transmission mechanism matters here, and Maryland's own Department of Housing and Community Development makes the connection for me: vacancy "suppresses the property values of legacy Black homeowners and widens the appraisal gap... reducing the number of healthy comps." Every vacant that gets renovated repairs the comp set that Black homeowners and buyers get appraised against.
Claim 5: The Part I Was Most Likely to Be Wrong About
This is the prediction that separates my theory from the boring alternative, that low rates simply lifted all boats, with Black buyers benefiting most.
If cheap money were the whole story, Black homeownership should have stalled or reversed when 30-year rates went from 3 to 7 percent in 2022, because Black buyers are, on average, the marginal buyer: less wealth, lower incomes, more FHA, most rate-sensitive.
The white rate did exactly what the rates story predicts, flat to down from 2022. The Black rate didn't. It rose 45.0 to 45.7 to 45.8 from 2022 to 2024 and printed 46.4 percent in Q4 2024, the best clean quarterly number since 2008.
The share of flips resold to FHA buyers rose three consecutive years, 8.4 percent in 2022 to 11.3 percent in 2025. Investors renovated cheap stock and sold it down-market to first-time, largely moderate-income buyers, at precisely the moment new construction and rate-locked existing owners abandoned that price point. In 2023 to 2025, a renovated flip was often the only entry-level product on the shelf.

Black owner-occupant purchases in low- and moderate-income tracts were still above their 2018 level in 2024, up 7.7 percent, while the overall purchase market shrank 19 percent.

Then 2025 gave part of it back. The Black rate fell from 45.8 to 44.6 while white held at 74.3. Part of this is measurement: the 2025 survey was reweighted to 2020 Census controls, which puts a break in the series. Part of it is real: the marginal buyer finally got priced out of even the renovated rowhouse. The machine cushions the marginal buyer against high rates. It does not make them rate-proof.
Then I Tried to Break It: Four Falsification Tests
In August 2026, I ran four tests specifically designed to break this theory. Two strong confirmations, one split decision, one null. Here's the scorecard, no varnish.
Test 1, Confirmed. The exit mechanism is directly observable in courthouse records.
This is my favorite part, because it's the mechanism caught on film. I traced roughly 75 Baltimore City deed and mortgage chains: cohorts of flip attempts, pulled from Kiavi's and Temple View's Baltimore purchase-bridge books at origination and traced forward to whatever happened next.
Completed renovations still sell overwhelmingly to owner-occupants, roughly 80 percent of resales went to individual buyers with institutional purchase money in every cohort, typically at 90 to 103 percent LTV. The FHA and assistance signal among confirmed financed buyers rose from 36 to 46 to 67 percent across cohorts. The chains now routinely show a 98.2 percent LTV FHA loan with a Maryland DHCD assistance second sitting behind it. That's a first-time buyer falling in love with a renovated rowhouse, in the public record.

The DSCR backstop itself was exercised on 13 percent of flip attempts in 2019 to 2020, rising to 26 percent in 2021 and 37 percent in 2023. The option multiplied attempts faster than its exercise diverted them.
One thing I want to be straight about: the 2023 backstop vintage is stressed. Two of ten DSCR refis in that cohort hit preforeclosure by late 2025. The back-up plan transfers risk through time. It doesn't erase it.
Test 2, Null. The metro test came back null. Calling it out, not burying it.
If my theory has a strong local form, the metros where the DSCR footprint grew most should show the biggest Black homeownership gains. They don't. Across 39 metros, the regression coefficient is approximately zero. The strong cross-market form of my theory is unproven, full stop. What survives is the national-timing form, which is what the other three tests speak to.
Test 3, Split. The engine sped up while the buyers thinned out.
2025 HMDA data shows investor originations rose 17.1 percent to 574,058, while Black owner-occupant purchases fell 3.9 percent in a market that grew 1.2 percent. The renovated product kept coming. Fewer Black buyers could reach it. That's the affordability wall, and no lending product fixes the affordability wall.
Test 4, Confirmed. Every rate shock since 1994, benchmarked. This one is the mildest on record.
I benchmarked every mortgage-rate shock since the race series began in 1994. The 2022 to 2023 shock was 4.2 points of mortgage rate, the biggest since 1981, and four years in, Black homeownership sits 0.7 points above its pre-shock baseline.
Compare that to the no-back-up-plan counterfactual: the GFC took Black homeownership down 2.9 points by year four and 5.6 by year nine, roughly double the white damage, and it never came back before COVID. Even the little 2013 taper did more harm than this monster.

The Strongest Case Against Me, Stated Fairly
Five counter-arguments I take seriously.
The back-up plan's exercise subtracts from homeownership. The same DSCR exit that de-risks the flip converts the unsold house into a rental. In 2021 to 2022, when investor purchases peaked at 28 percent of single-family sales, the FHA share of flip exits halved to roughly 8 percent. The option's existence raises renovation volume; its exercise takes houses out of the ownership pool. Both are true at once.
Investor concentration can crowd out Black buyers. Peer-reviewed post-GFC research finds institutional SFR buyers concentrating in Black neighborhoods reduced transitions into homeownership, and a 2024 Atlanta study attributes a real share of that market's Black homeownership decline to the same dynamic. Most of this evidence is about buy-and-hold institutional landlords, not flippers, and predates 2020, but it's the same capital pool this machine feeds. I'm not going to pretend otherwise.
Renovation reprices affordable stock. The NYC flip study found flipped homes moving from prices affordable at 95 percent of area median income to 163 percent post-flip. A beautiful renovation a family falls in love with is also a more expensive house.
Down-market externalities flip sign. The research shows flipping raises neighboring values in up markets and depresses them in down markets. The de-risked machine amplifies whatever cycle it's operating in, a thing worth remembering in a year like this one.
Confounders share the podium. 2020-21 rates, stimulus savings, remote work, peak-millennial first-time buying, and record Black income growth all pushed the same direction in the same window. The 2022 to 2024 decoupling is my best exhibit precisely because most of those confounders had already reversed by then.
Net: the counter-evidence is mostly about a different investor, the institutional buy-and-hold landlord, and a different era, post-GFC distress buying. The flip-to-FHA-buyer pipeline, the core of my theory, only moves homeownership in one direction, and it's the pipeline that measurably grew in the high-rate era.
Where I Land
The theory holds up, including the part where I stuck my neck out.
At the property level, the mechanism is caught on film: the back-up plan exists, gets exercised exactly when the flip doesn't sell, and multiplied attempts faster than it diverted houses to rentals.
At the national level, the macro signature is real and historically anomalous in exactly the direction I predicted: the biggest rate shock in four decades produced the mildest Black-homeownership response on record.
At the metro level, I can't show dose-response. This stays a story about a national credit product changing national investor behavior, and I'll hold the local version with an open hand.
And the binding constraint has moved. The machine is still producing, but 2025 shows the marginal buyer getting priced out anyway. With defaults rising across DSCR and RTL in 2026 and the mood out there getting darker, the 2023 vintage is the one to watch.
Cushion, not immunity. That's the honest summary.
Learn More About Dominion FinancialAbout the Author

Jack BeVier
Partner at Dominion Financial
Jack BeVier has been with Dominion Financial since 2007, working hands-on in nearly every area of single-family real estate investing, from acquisitions and construction to financing and business development. Today, he helps lead Dominion Financial as a nationally recognized private lender serving experienced investors. Jack is a Wharton graduate and co-founder of Baltimore’s Small Developer’s Collective, as well as co-founder of the Real Investor Roundtable. He is also the co-host of the Real Investor Radio podcast and the 4kd.ai podcast.
Related Posts
View all Market Insight →
What the 2021-2022 Buying Spree Got Wrong (And Replacement Cost Would Have Caught)
Institutional real estate investors who bought heavily in 2021-2022 often underwrote deals using IRR models and compressed cap rates that assumed cheap refinancing and aggressive rent growth would continue indefinitely. When interest rates rose and rent growth slowed, those assumptions broke down, and many of the same buyers became net sellers. Replacement cost, the cost to build a comparable property today, would have flagged those deals as overpriced regardless of interest rate assumptions, since it depends only on current land and construction costs rather than forecasts. As of 2024, construction costs made up a record 64.4% of a new home's average sales price in the U.S., according to the National Association of Home Builders, making replacement cost an increasingly useful underwriting benchmark for investors in 2026.
October 5, 2026
The Fed Raised Rates for the First Time Since 2023. Here's What It Means for Your Next Deal
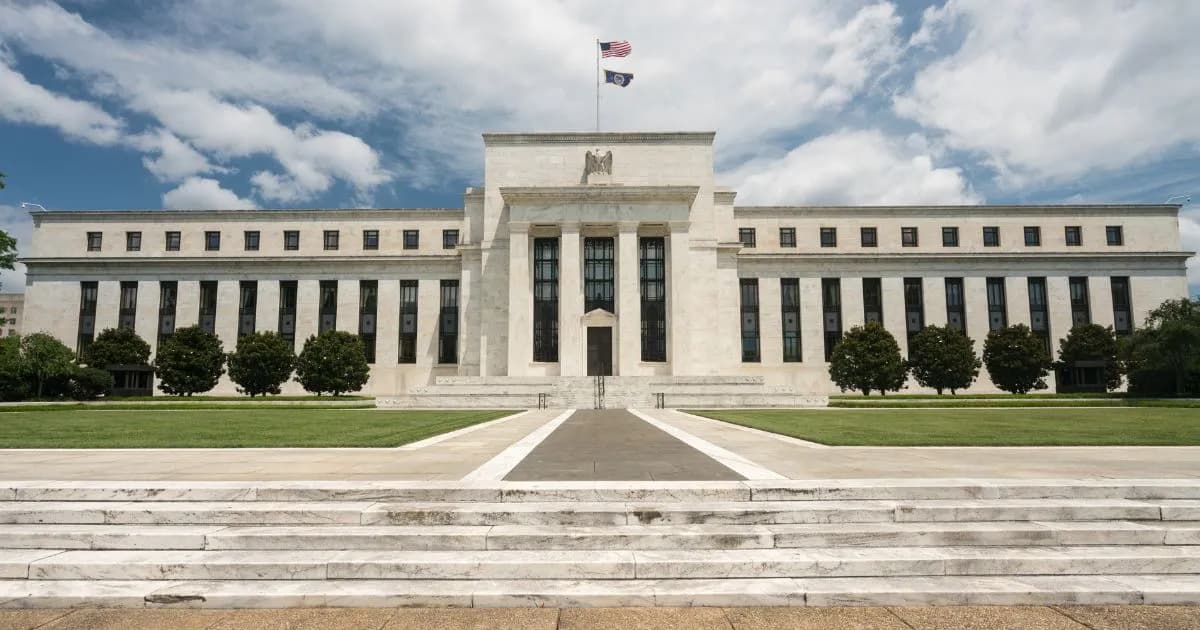
On September 16, 2026, the Federal Reserve raised the federal funds rate by 25 basis points to a target range of 3.75%-4.00%, its first hike since 2023, citing a strong economy and elevated inflation. Mortgage rates have already risen in response. For real estate investors, this means financing costs may stay elevated longer than expected, making speed, deal structure, and lender reliability more important. Dominion Financial offers DSCR rental and fix and flip loans with in-house underwriting designed to close quickly and deliver on quoted terms in shifting rate environments.
September 17, 2026

What the 21st Century ROAD to Housing Act Means for Institutional Investors
Signed into law in July 2026, the 21st Century ROAD to Housing Act restricts institutional investors controlling 350 or more single-family homes from making additional purchases, effective January 7, 2027. The law does not require divestiture of existing holdings and applies only to future acquisitions. Exceptions remain available for build-to-rent programs, renovate-to-rent projects, foreclosure transactions, and purchases from other qualifying investors. Investors below the 350-home threshold, including most smaller and mid-sized investors, are not affected by the restriction.
August 31, 2026