
US Treasury Yield Curve: What It Means for Real Estate Investors
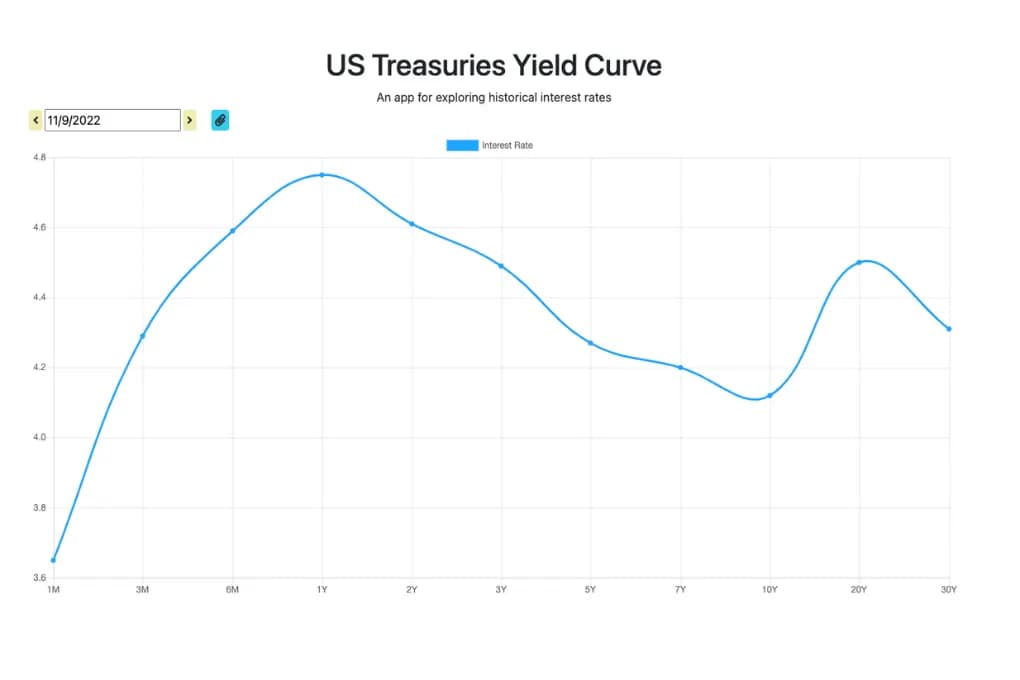
The U.S. Treasury yield curve shows how interest rates vary across short- and long-term government debt, and it directly influences real estate loan pricing.
When the curve inverts (meaning short-term rates exceed long-term rates) borrowing costs for investors often rise while signaling potential economic slowdown. Understanding this relationship helps real estate investors compare loan options and minimize borrowing costs.
What Is the Treasury Yield Curve?
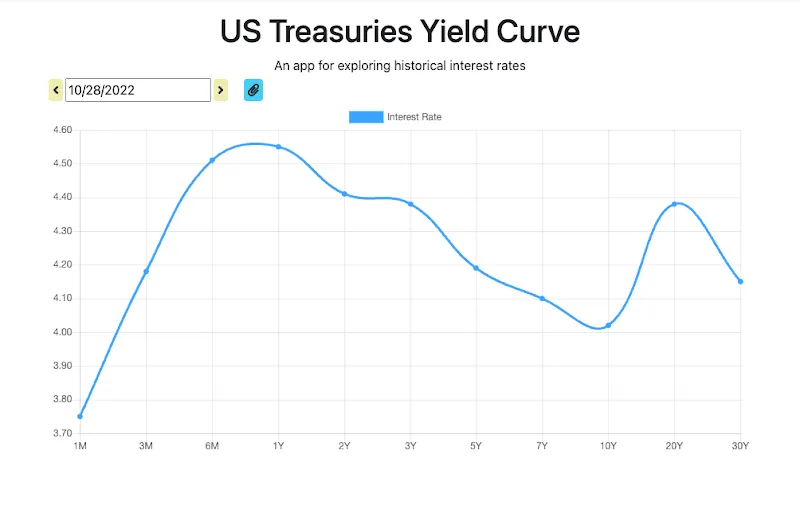
The Treasury yield curve is a graph of interest rates the U.S. government pays to borrow money across different time horizons, from short-term Treasury bills to long-term bonds.
Under normal conditions, longer-term rates are higher than short-term rates to compensate for time and risk. However, when short-term rates exceed long-term rates, the curve becomes inverted, signaling tighter financial conditions and increased market uncertainty.
For current yield data, refer to the Federal Reserve or U.S. Treasury website.
Why the Yield Curve Matters for Real Estate Investors
Treasury yields serve as the baseline (“risk-free rate”) for nearly all lending. Real estate loan rates are built on:
Loan Rate = Treasury Yield + Credit Spread
The credit spread reflects the lender’s risk premium, covering borrower risk, market volatility, and profit margin.
When Treasury yields rise:
- Borrowing costs increase
- Lender spreads may widen
- Deal margins compress
When yields fall:
- Financing becomes cheaper
- Investor demand typically increases
How Different Real Estate Loans Are Priced
Fix-and-Flip and Bridge Loans
Short-term loans are typically tied to short-duration Treasury yields (often around 1-year benchmarks).
- Rising short-term yields → higher borrowing costs
- Lenders may adjust pricing unevenly → opportunity to shop rates
DSCR Loans (Rental Property Financing)
DSCR loans are commonly benchmarked against mid-term Treasury yields (around 5-year) due to typical loan payoff timelines.
- Loan rates reflect both yield changes and investor demand
- Prepayment structures impact pricing (longer penalties = lower rates)
Investors should compare both rate AND structure, not just headline pricing.
Residential Mortgages
Traditional mortgages are generally tied to intermediate-term Treasury yields (5–10 years).
- These rates reflect long-term expectations for inflation and economic growth
- Mortgage rates may diverge from Treasuries based on market demand
Market Volatility and Credit Spreads
Treasury yields are only part of the equation. The credit spread also fluctuates based on:
- Investor demand for mortgage-backed securities
- Economic uncertainty
- Liquidity in lending markets
In volatile environments:
- Investors demand higher returns
- Lenders increase spreads
- Borrowers face “double pressure” from rising base rates + spreads
How to Compare Loan Offers Using the Yield Curve
Instead of comparing interest rates alone, evaluate the spread over Treasury yields.
Example:
Loan Term | Loan Rate | Treasury Yield | Credit Spread |
10-year | 6.5% | ~4.0% | 2.5% |
7-year | 6.5% | ~4.1% | 2.4% |
Even with identical rates, the lower spread represents a better deal.
Key takeaway:
Focus on:
- Spread efficiency
- Loan term alignment
- Prepayment flexibility
Strategy: Getting the Best Loan Terms
To optimize financing:
- Evaluate credit spreads, not just rates
- Match loan term to your investment timeline
- Monitor Treasury trends via Federal Reserve data
- Lock rates strategically when volatility is high
Looking to finance your next investment? Explore our DSCR rental loan programs and compare options designed for real estate investors.
This article is for informational purposes only and does not constitute financial, tax, or legal advice. Consult a qualified professional regarding your individual situation.
Frequently Asked Questions
What does an inverted yield curve mean for real estate investors?
How do Treasury yields affect mortgage rates?
What is a credit spread in real estate lending?
Which Treasury yield matters most for DSCR loans?
Should investors wait for rates to drop?
Related Posts
View all Market Insight →
Migration + Demographics: The Real Estate Thesis Supply Data Can't Replace
Migration and demographic trends determine the long-term demand floor for a real estate market, while supply and absorption data explain shorter-term cyclical price and vacancy swings within that market. According to U.S. Census Bureau estimates, 31 states had positive net domestic migration between July 2024 and June 2025, led by North Carolina (84,000+ net arrivals), Texas (67,300), South Carolina (66,600), and Tennessee (42,000+). Florida's net domestic migration dropped sharply to 22,517 in 2025, down from 310,892 in 2022, reflecting rising property taxes, insurance costs, and home prices eroding its pandemic-era affordability advantage. Meanwhile, the Midwest posted positive net domestic migration for the first time this decade. Investors should evaluate both migration trends and current supply/absorption conditions together, since a market can have strong migration and still be temporarily oversupplied, or weak migration and still be tight due to limited new construction.
October 19, 2026

Why "Normalized" Rates Don't Mean a Normal Housing Market
As of September 2026, the 10-year Treasury yield (near 4.9-5%) and 30-year mortgage rates (around 6.67-6.76%) have returned to ranges considered historically normal by pre-2010 standards. Despite this, U.S. existing-home sales remain historically weak, falling to a seasonally adjusted annual rate of 3.98 million in August 2026, with months' supply climbing to 4.9, the highest level in over a decade, according to the National Association of Realtors. The gap between "normal" rates and a still-frozen transaction market is driven primarily by the mortgage rate lock-in effect: homeowners who bought or refinanced at 2.5-3.5% during 2020-2021 face a strong financial disincentive to sell, since moving means giving up that rate for a new mortgage well above 6%. This lock-in effect unwinds gradually, driven by individual life events rather than rate changes, meaning transaction volume may stay subdued even if rates hold steady or ease modestly.
October 12, 2026

What the 2021-2022 Buying Spree Got Wrong (And Replacement Cost Would Have Caught)
Institutional real estate investors who bought heavily in 2021-2022 often underwrote deals using IRR models and compressed cap rates that assumed cheap refinancing and aggressive rent growth would continue indefinitely. When interest rates rose and rent growth slowed, those assumptions broke down, and many of the same buyers became net sellers. Replacement cost, the cost to build a comparable property today, would have flagged those deals as overpriced regardless of interest rate assumptions, since it depends only on current land and construction costs rather than forecasts. As of 2024, construction costs made up a record 64.4% of a new home's average sales price in the U.S., according to the National Association of Home Builders, making replacement cost an increasingly useful underwriting benchmark for investors in 2026.
October 5, 2026