
Foreclosures Are Rising Again in the Second Half of 2026
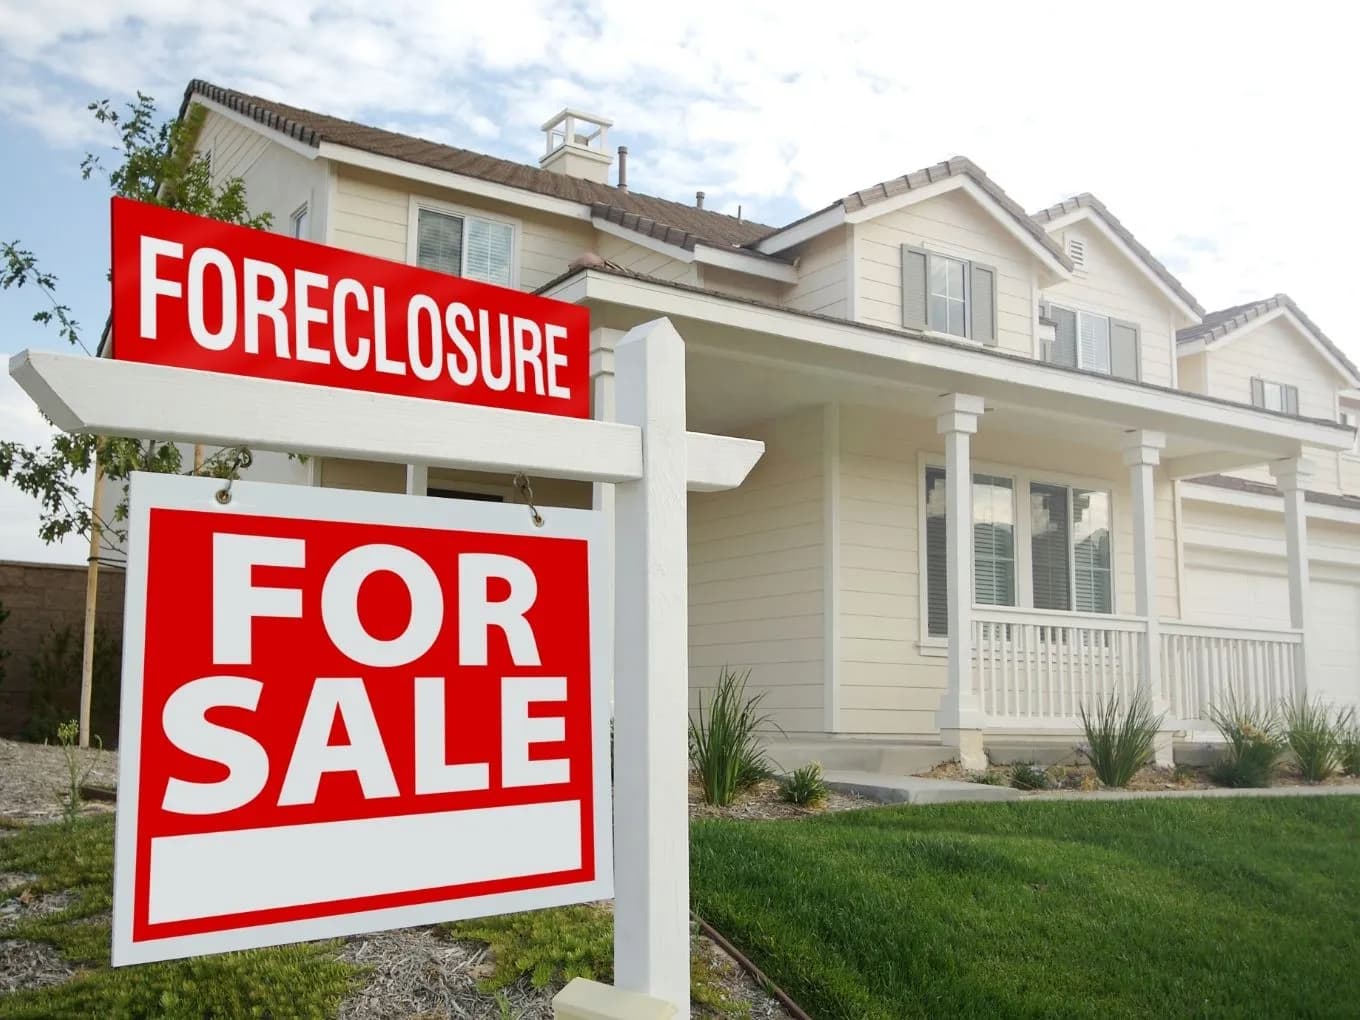
Foreclosure activity is climbing again in 2026, and that means more distressed inventory is entering the market for real estate investors willing to move on it. According to ATTOM's Mid Year 2026 U.S. Foreclosure Market Report, 227,548 U.S. properties had a foreclosure filing in the first six months of the year, up 21 percent from the same period in 2025. For investors, more filings mean more entry points, whether that is a homeowner in early default, a scheduled auction, or a bank-owned property waiting to be resold. The opportunity is real, but it is not spread evenly, and the smartest investors are matching their strategy to the type of market they are working in.
The State of the Market in 2026
The topline numbers confirm foreclosure activity is normalizing after years of historically low levels, not spiking to crisis levels. Foreclosure starts, the point where a lender first files notice of default, totaled 164,566 in the first half of 2026, up 18 percent year over year. Bank repossessions, known as REO, rose 33 percent to 27,983 properties, meaning more homes are completing the process and landing back on the market through the lender. At the same time, the average foreclosure timeline dropped to 563 days in the second quarter, the shortest span since 2013 and down 13 percent from a year ago. Nationally, one in every 632 housing units had a foreclosure filing in the first half of the year, a rate of 0.16 percent. Rising filings paired with shrinking timelines is a meaningful signal. Deals are surfacing faster, and capital tied to those deals is not sitting idle as long as it used to.
Where Distress Is Growing Fastest
Some states were considered stable a year ago and are now seeing sharp increases in foreclosure activity. Among states with at least 500 filings in the first half of 2026, the largest year-over-year jumps were Idaho, up 59%; Colorado, up 57%; Georgia, up 52%; North Carolina, up 47%; and Mississippi, up 45%. None of these states rank among the highest foreclosure rates in the country today. That is the point. Rapid growth in a market that was previously healthy is a leading indicator, not a lagging one. Investors who track these markets now, before filing volume peaks and before competing investors notice, tend to get better pricing and early acquisition. Waiting until a state shows up on every investor's radar usually means arriving after the best deals are gone.
Where Distress Is Already Highest
Fast growth and high concentration are two different signals, and conflating them leads to the wrong strategy. The states with the deepest pool of distressed inventory right now, measured by foreclosure rate rather than growth rate, are Florida at 0.27% of housing units, South Carolina at 0.26%, Indiana and Delaware both at 0.25%, and Illinois at 0.23%. These markets already carry a mature, steady supply of distressed properties. On the metro level, Punta Gorda and Lakeland in Florida, along with Columbia, South Carolina, post the worst foreclosure rates of any metro area with a population of 200,000 or more. For investors sourcing auction and REO deals today rather than waiting for a market to develop, these are the states and metros with the largest active pipeline to work.
Where There Is the Most Total Deal Volume
A state can carry a modest foreclosure rate and still produce more total deals than almost anywhere else in the country, simply because of its size. Texas led the nation in foreclosure starts in the first half of 2026 with 20,739, followed closely by Florida at 20,358, then California at 16,040, Georgia at 8,164, and Illinois at 7,424. Texas ranks 12th nationally in foreclosure rate, yet it produces more raw deal volume than almost every state with a higher rate. This distinction matters most for investors scaling toward a larger rental portfolio or a higher flip count each year, not just those closing an occasional deal. If your model depends on steady throughput, total volume states like Texas, Florida, and California will keep a pipeline full even when the foreclosure rate in any single one of them looks unremarkable on paper.
Matching Strategy to Market Type
Not every foreclosure market rewards the same approach. The right strategy depends on where a market falls across growth, concentration, and volume.
Strategy | Best fit market type | Why it works there |
Reaching homeowners in pre-foreclosure | Fast growing, less crowded markets like Idaho, Colorado, or Georgia | Fewer investors are watching these markets yet, so early outreach faces less competition and homeowners have more equity left to negotiate around |
Buying at auction or from banks as REO | High volume, fast timeline markets like Texas, Florida, and California | A steady stream of scheduled sales and bank owned inventory supports repeatable acquisition, and shorter timelines in states like Texas mean capital turns over quickly |
Buying and holding as a long-term rental | Markets with steady, elevated distress but limited price appreciation | Consistent inventory keeps acquisition costs down, and a DSCR rental loan lets an investor qualify on the property's cash flow rather than personal income, which fits a portfolio building strategy well |
These deals move on a set schedule, so an investor needs financing that can move just as fast. A fix and flip loan built for rapid closings keeps an investor competitive when a courthouse auction date will not wait on a slow lender.
For a long-term hold, a DSCR rental loan lets an investor qualify based on the property's rental income, which supports scaling a portfolio without the underwriting delays of a conventional loan.
Why Foreclosure Rate Alone Is Not Enough
A high foreclosure rate is not automatically a green light, and timeline matters just as much as volume. Some states process foreclosures far slower than others, which ties up an investor's capital and delays the moment a property actually becomes available. States with the longest average foreclosure timelines in the second quarter of 2026 included Louisiana at 3,491 days, Hawaii at 2,293 days, and New York at 2,007 days. Compare that to Texas, where the average foreclosure completed in just 155 days, or New Hampshire at 157 days. An investor targeting REO inventory in Louisiana or New York may be waiting years longer for that same property to clear the process than an investor working the identical strategy in Texas. Before choosing a market based on its foreclosure rate, check the average timeline for that state. A market with a high rate and a long timeline often ties up more capital than it is worth.
Whichever market and strategy fit, speed and financing terms end up mattering as much as picking the right state.
How Dominion Financial Supports Investors Working Foreclosure Deals
Foreclosure-driven deals move on someone else's schedule, not the investor's, whether that means an auction date, a bank's deadline on an REO offer, or a homeowner in pre-foreclosure who needs a fast, clear answer. Dominion Financial built its loan programs around that reality, so investors can close in days, not weeks. Dominion Financial's fix and flip loans fund up to 100% of acquisition and 100% of rehab costs for qualifying borrowers, with no appraisal required on short-term bridge loans. For investors planning to hold a distressed acquisition as a rental once it is stabilized, Dominion Financial's DSCR rental loans qualify based on the property's cash flow, with a price beat guarantee and closings in as little as 10 days through the Express Rental Loan program. Investors working larger multifamily distress situations can also look at Dominion Financial's multifamily bridge loans to fund acquisition and repositioning in one loan.
Takeaways
Foreclosure activity is rising in 2026, but where an investor should look depends on whether they want to get ahead of a growing market, work an established pipeline of distressed inventory, or chase raw volume at scale. Idaho, Colorado, Georgia, North Carolina, and Mississippi are worth watching now before competition catches up. Florida, South Carolina, Indiana, Delaware, and Illinois already carry the deepest pool of distressed properties. Texas, Florida, and California produce the most total deal volume for investors who need consistent monthly flow. Whichever market fits your strategy, check the average foreclosure timeline before committing capital, since a high rate paired with a slow process can leave you waiting far longer than a competing market with a faster clock.
Ready to move on a distressed property before the next investor does? Talk to Dominion Financial about fix and flip, DSCR rental, and multifamily bridge financing built for the speed foreclosure deals require.
Frequently Asked Questions
Is a rising foreclosure rate a sign of another housing crash?
What is the difference between a foreclosure start and a completed foreclosure?
Should I focus on states with the highest foreclosure rate?
How fast can Dominion Financial close on a distressed property acquisition?
What is pre-foreclosure outreach and when does it make sense?
Related Posts
View all Market Insight →
The Fed Raised Rates for the First Time Since 2023. Here's What It Means for Your Next Deal
On September 16, 2026, the Federal Reserve raised the federal funds rate by 25 basis points to a target range of 3.75%-4.00%, its first hike since 2023, citing a strong economy and elevated inflation. Mortgage rates have already risen in response. For real estate investors, this means financing costs may stay elevated longer than expected, making speed, deal structure, and lender reliability more important. Dominion Financial offers DSCR rental and fix and flip loans with in-house underwriting designed to close quickly and deliver on quoted terms in shifting rate environments.
September 17, 2026

What the 21st Century ROAD to Housing Act Means for Institutional Investors
Signed into law in July 2026, the 21st Century ROAD to Housing Act restricts institutional investors controlling 350 or more single-family homes from making additional purchases, effective January 7, 2027. The law does not require divestiture of existing holdings and applies only to future acquisitions. Exceptions remain available for build-to-rent programs, renovate-to-rent projects, foreclosure transactions, and purchases from other qualifying investors. Investors below the 350-home threshold, including most smaller and mid-sized investors, are not affected by the restriction.
August 31, 2026
Is It Really a Buyer's Market in 2026? What the Data Actually Shows Investors
The 2026 housing market shows mixed signals rather than a clear-cut buyer's market. Inventory is rising but growth has slowed sharply from last year's pace, and while some states have surpassed pre-pandemic supply levels, most remain historically tight. The "lock-in effect" (homeowners holding onto low pandemic-era mortgage rates) is suppressing new listings even as overall inventory climbs, meaning today's sellers are often more motivated (relocation, distress, life events). Price cuts are increasingly common and median list prices have declined for nine consecutive months, though the extent varies widely by metro. Notably, homes are selling slightly faster than a year ago and pending sales keep growing, showing buyer demand hasn't disappeared. For investors, the takeaway is that leverage has improved but success now depends on submarket-level analysis and moving quickly on realistically priced or off-market deals, backed by fast, ready financing such as DSCR loans or fix-and-flip capital.
August 19, 2026